Fundamentals of Digital Forensics
4. Acquisition and analysis of volatile information
4.2. Memory Acquisition Analysis
There are some memory dump analysis tools that are based only on the contents of RAM. These contents may be incomplete, since parts of the memory are stored on disk when it is not enough to store all the data. To overcome this problem, Nicholas Paul Maclean published his thesis, “Acquisition and Analysis of Windows Memory”, how memory management works on Windows systems and provided an open-source tool called vtop to fully reconstruct the virtual memory space of a process.
For the analysis of the Memory Dump we can use the program Volatility, where it is possible to perform tasks such as obtaining high-level information about the image, where the operating system identification (Figure 35), service pack, hardware, architecture, memory address and the time of the Dump is deduced.
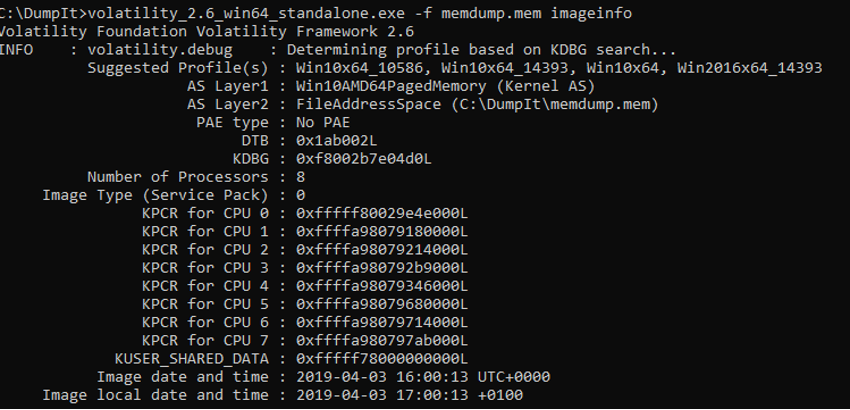
Figure 35 – Getting information about a memory dump
Commands useful for performing a record dump:
Export to text:
C:\Regdmp.exe > e:\registryDump.txt
Find Expressions in the exported file:
C:\Find/i "URL" registryDump.txt
Copy of the registry files in use:
C:\RawCopy.exe C:\WINDOWS\system32\config\SYSTEM E:\output -AllAttr
Other useful commands:
Get a screenshot of the desktop:
C:\nircmd.exe savescreenshot screen1.png (Nirsoft.net)
Checking that the disk is protected with Encryption (Figure 36)
C:\EDD.exe /accepteula /Batch > e:\EncryptedDiskDetector.txt
C:\Manage-bde –protectors c: -get
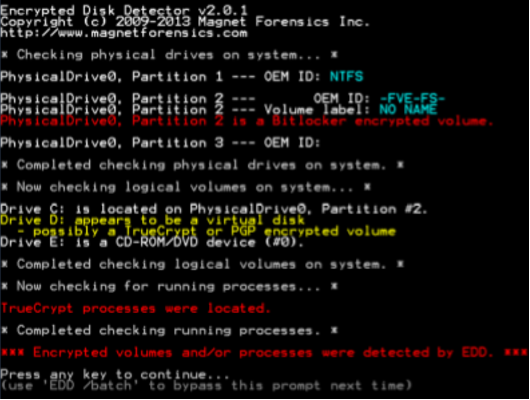
Figure 36 – Identifying an encrypted disk
4.2.1. Sintax of the Volatility program
The first version of the Volatility Framework was released at a Black Hat conference. The software is based on years of academic research in advanced memory analysis and forensics. Volatility now allows researchers to analyze what state the machine was in at the time the acquisition was made, based on data gathered from volatile memory.
The Volatility Framework is based on the Python programming language, being developed in Python 2 its most mature version, being this the one we will address in this topic. With the appearance of Python 3, there was also a need to update the Volatility version, taking advantage of the new Python version and providing it with more automation. In version 2 of the Volatility Framework, the first step in performing a memory analysis is to identify the type of Operating System. To do this we can use the imageinfo command of the Volatility program (Figure 37). This command is useful for obtaining high level information about the image, it indicates the probable operating system identification (profile), service pack, hardware architecture, memory address and the time of the Dump.

Figure 37 - Volatility – Example output of the imageinfo command
Later we must pass the contents of memory to text files so that an analysis of its contents is possible. Volatility provides a number of plugins for this purpose.
Sintax: volatility -f <nome_da_imagem> -profile=<tipo_de_OS> <plugin> > <output>
· -f: File resulting from the system acquisition
· -profile: instruction to use the operating system profile (previously identified)
· plugin: plugin to be executed
· output: file to export the results
4.2.2. Volatility Plugins - Extraction
The plugins that volatility uses are specific to the identification of the respective information in the RAM dump content. We will cover some of these pulgins here.
Pslist List Running Processes
Pstree Display processes, differentiating them in their origin (Figure 38)
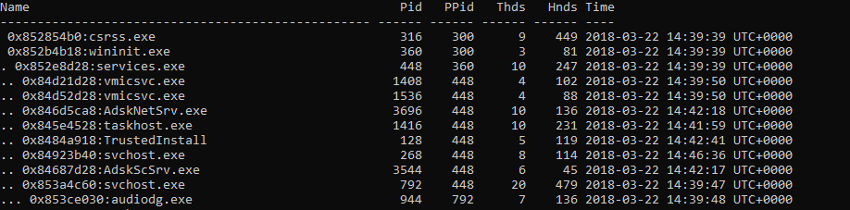
Figure 38 - volatility pstree Plugin
Psxview Compare processes (Figure 39)
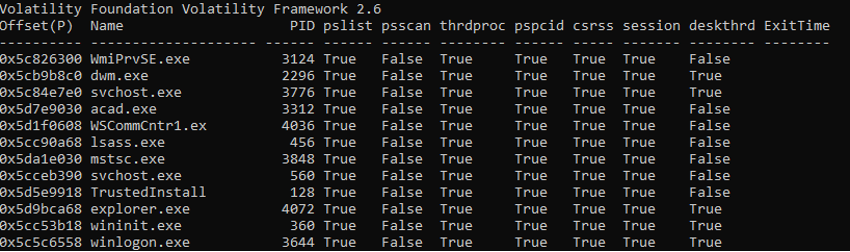
Figure 39 – Volatility psxview plugin
Netscan Display network connections
Cmdline Cmdline Compare processes (Figure 40)
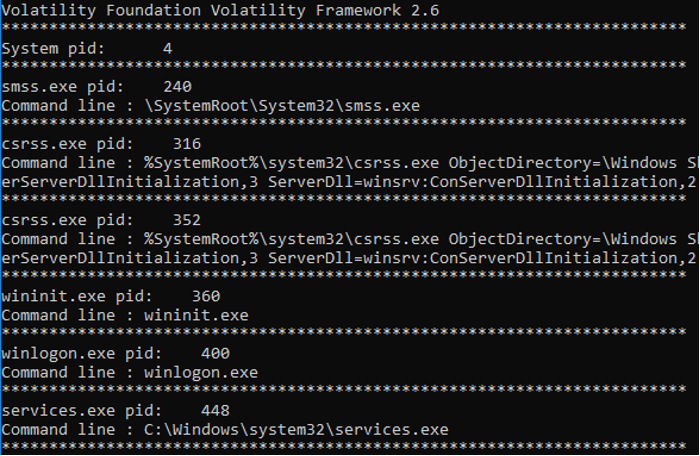
Figure 40 – Volatility cmdline plugin
Cmdscan Compare processes (Figure 41)
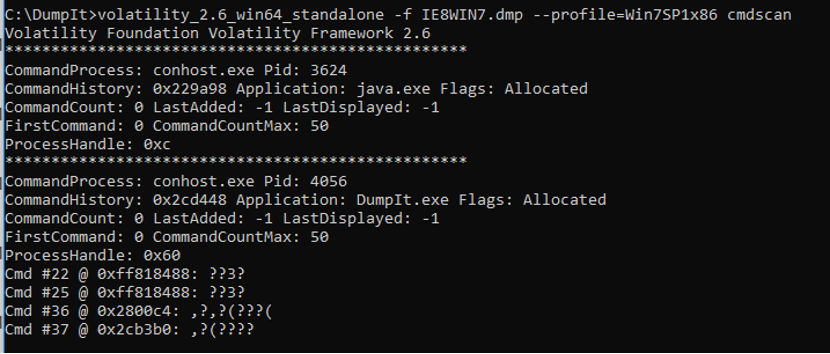
Figure 41 – Volatility cmdscan plugin
Consoles. Compare processes (Figure 42)
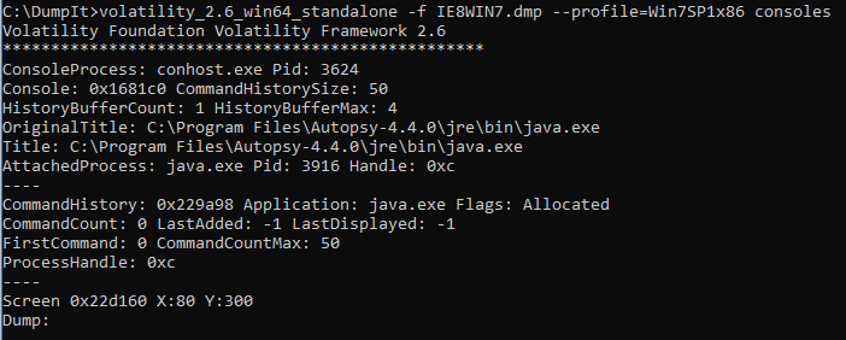
Figure 42 – Volatility consoles plugin
Dumpregistry Extract log files
4.2.3. Plugins Volatility – Analysis
With the log files that have been extracted from the memory, it is possible to analyze them with the same tools as the log files extracted from the operating system. An example of this is RegRipper, volatility itself, or RegistryReport, shown in Figure 43.
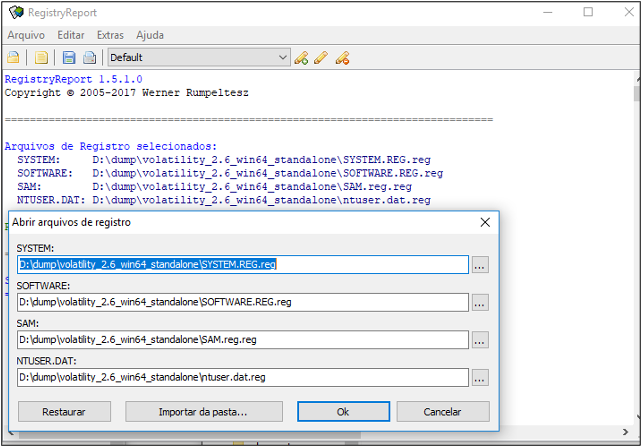
Figure 43 – RegistryReport file analysis
In the analysis of the memory it is also possible to obtain files that have been processed. There are some programs with the possibility of identifying and extracting files from the memory, as shown in the following figure with the Belkasoft software, where it is possible to verify that it identified browsing addresses in browsers, chat conversation data, email files and image files (Figure 44).
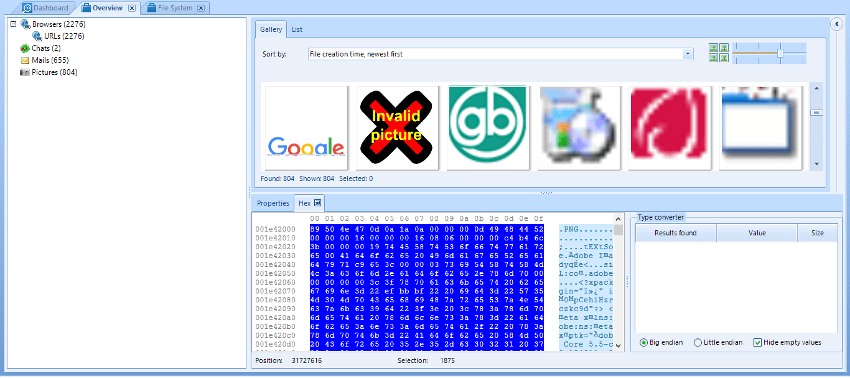
Figure 44 – File analysis with Belkasoft
SANS has published a Poster (Figure 45) alluding to memory analysis with Volatility, which summarises many of the plugins useful in this type of analysis.
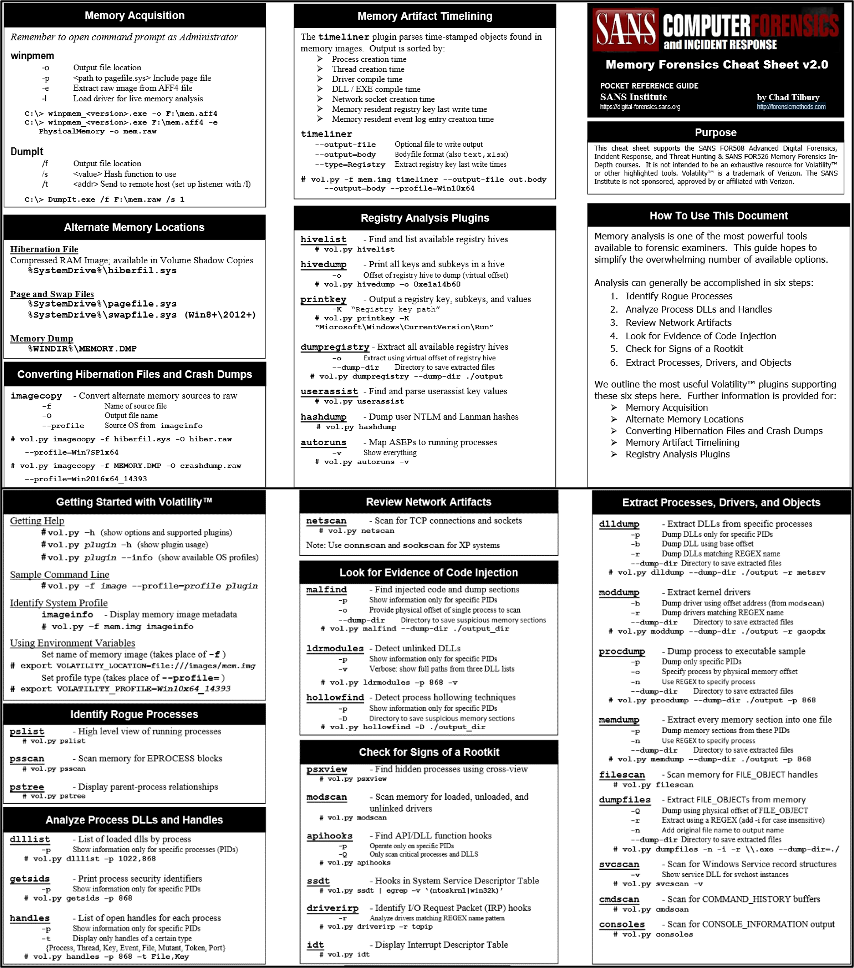
Figure 45 – SANS Poster - Memory Forensics Cheat Sheet v2.0
Create a TimeLine of events in memory
With the data extracted from volatile memory it is useful to create a Timeline, to make it possible to date and sort the indications in the system. This is a process involving the procedures described below:
Timeliner create a timeline
C:\> volatility_2.6_win64_standalone.exe -f IE8WIN7.dmp --profile=Win7SP1x86_23418 timeliner -- output=body > timeliner.body
Read more: https://volatility-labs.blogspot.com/2013/05/movp-ii-23-creating-timelines-with.html
Mftparser Obt (Master File Table).
C:\> volatility_2.6_win64_standalone.exe -f IE8WIN7.dmp --profile=Win7SP1x86_23418 mftparser -- output=body > mftparser.body
Combine the files concerning the timeliner and mftparser plugins.
# cat timeliner.body mftparser.body >> timeline.log
Mactime[1] Generate the timeline from the combination of files
# mactime -d -b timeline.log > timeline.csv
Final result of the TimeLine procedures (Figure 46)
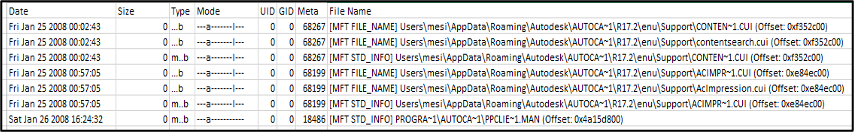
Figure 46 – Content of timeline.csv
With this table it is possible to easily identify the actions passed in the device memory, and these will complement the information obtained in the device analysis in dead-box forensics.
Example of identification of access to the TOR network
As an exemple of memory data analysis, we have the use of Tor Browser, since it does not store navigation information on the hard disk, although it is possible to identify and analyse it through memory.
We start by confirming the system profile (Figure 47).
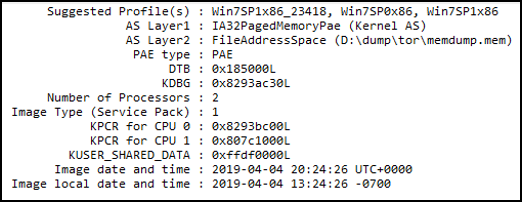
Figure 47 – Volatility imageinfo plugin
We used the pstree plugin to check the running processes, filtering the processes by the name “firefox.exe” (Figure 48), since Tor Browser uses this process, or directly by the name “tor.exe”. To get more information about the processes in the device under analysis, we still have the possibility to use the pslist, psscan plugins.
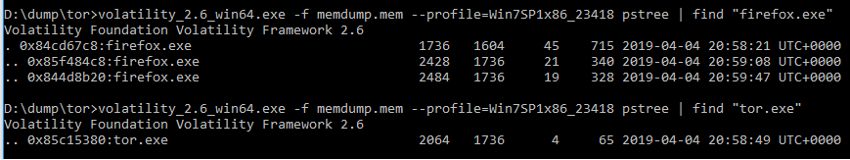
Figure 48 – Using volatility in process research
Getsids Information about the start of the process, relating the process to the user (Figure 49).
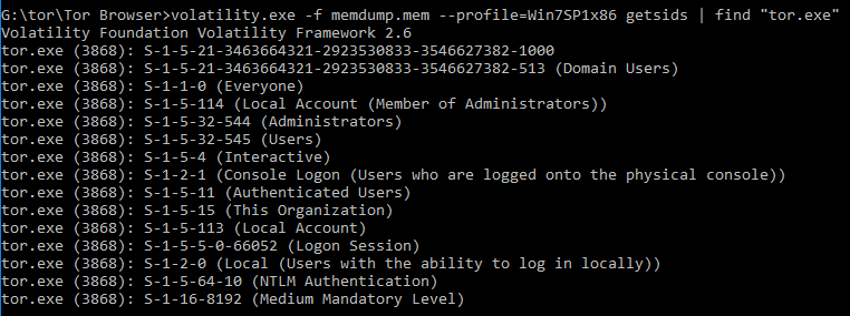
Figure 49 – Using volatility in process identification
netscan display the network connections
In this case, the “tor.exe” process indicates a completed connection to the destination IP “54.37.17.235” on port 9001 (Figure 50).
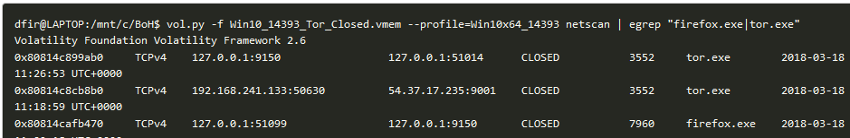
Figure 50 – Using Volatility in network identification
Firefoxhistory List the addresses (URLs) queried (Figure 51).
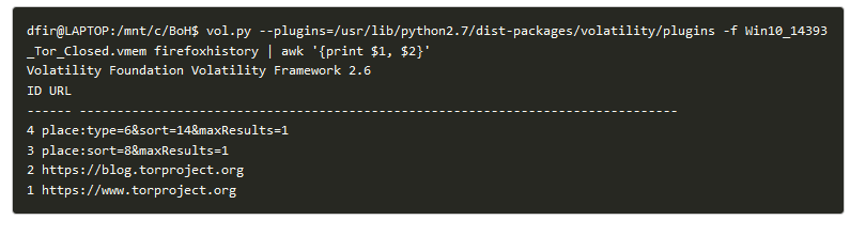
Figure 51 – Using volatility to retrieve URLs from memory
Source: https://blog.superponible.com/2014/08/31/volatility-plugin-firefox-history/